Edit chart
Loading graph
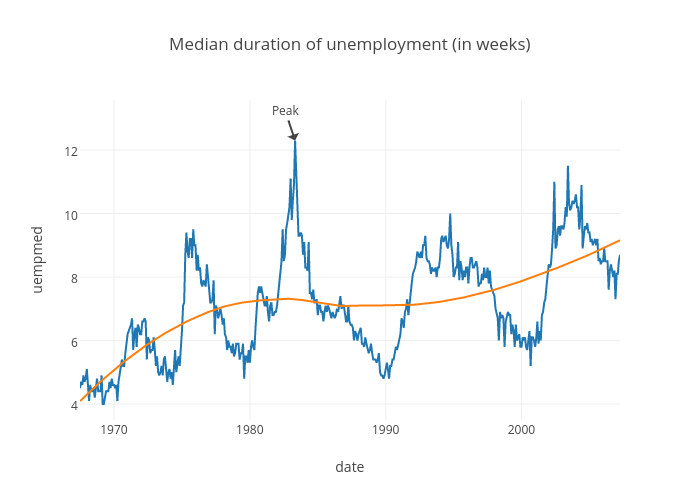
Rplotbot's interactive graph and data of "Median duration of unemployment (in weeks)" is a scatter chart; with date in the x-axis and uempmed in the y-axis.. The x-axis shows values from 0 to 0. The y-axis shows values from 0 to 0. This visualization has the following annotation: Peak