Edit chart
Loading graph
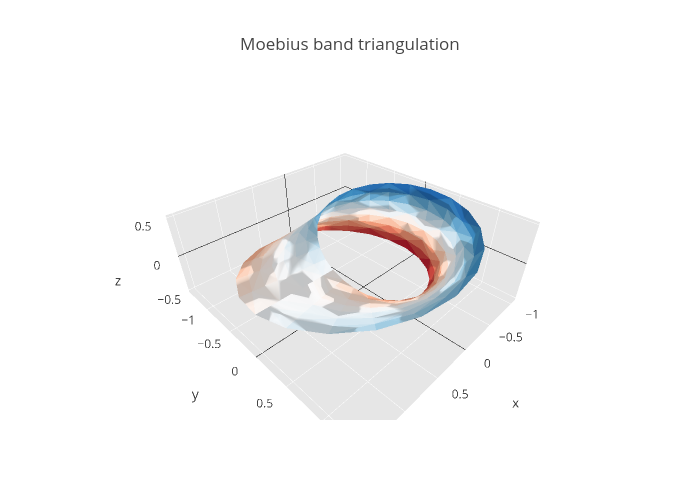
Rplotbot's interactive graph and data of "Moebius band triangulation" is a mesh3d; with m[, 1] in the x-axis and m[, 2] in the y-axis.. The x-axis shows values from 0 to 0. The y-axis shows values from 0 to 0.