Edit chart
Loading graph
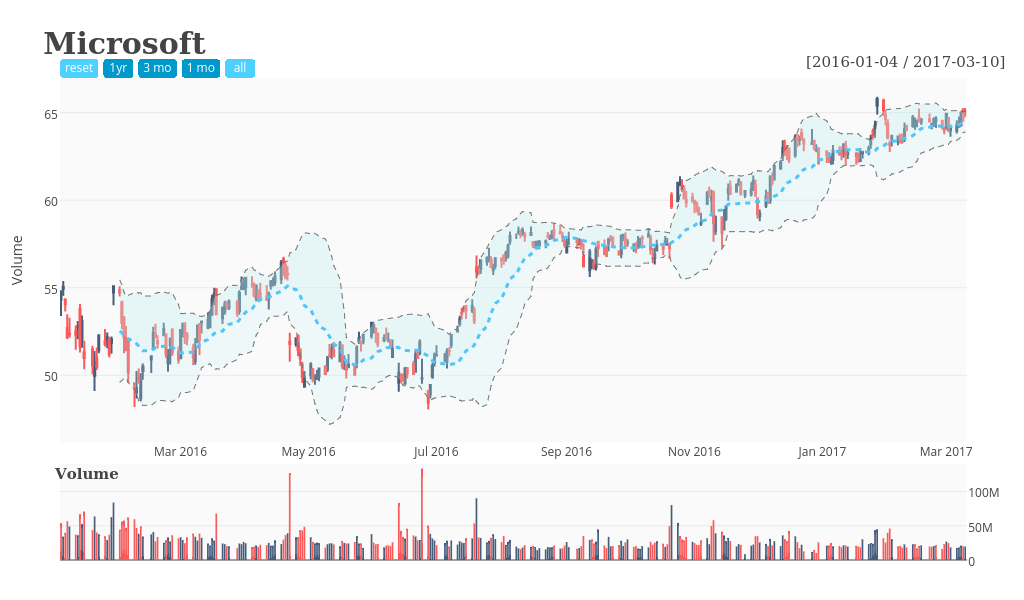
Rplotbot's interactive graph and data of "Price, Vol, Mov Avg, Bollinger, Bollinger" is a candlestick, showing Price, Vol, Mov Avg, Bollinger, Bollinger; with Volume in the y-axis. The x-axis shows values from 0 to 0. The y-axis shows values from 0 to 0. This visualization has the following annotations: Microsoft; [2016-01-04 / 2017-03-10]; Volume