Edit chart
Loading graph
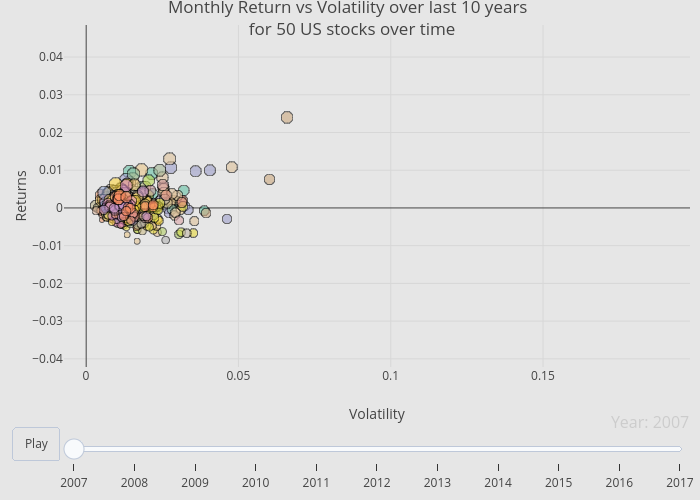
Rplotbot's interactive graph and data of "Monthly Return vs Volatility over last 10 years for 50 US stocks over time" is a scatter chart, showing AAPL, AMGN, AMZN, BAC, BRK-A, BTI, C, CHL, CMCSA, CSCO, CVX, CX, DIS, GE, GOOGL, HD, HSBC, IBM, INTC, JNJ, JPM, KO, MA, MDT, MMM, MO, MRK, MSFT, NVS, ORCL, PEP, PFE, PG, RDS-A, SAP, T, TOT, TSM, UL, UNH, VZ, WFC, WMT, XOM; with Volatility in the x-axis and Returns in the y-axis.. The x-axis shows values from -0.00728078289323722 to 0.198237285841611. The y-axis shows values from -0.0421527307924067 to 0.0484760529395676.