Edit chart
Loading graph
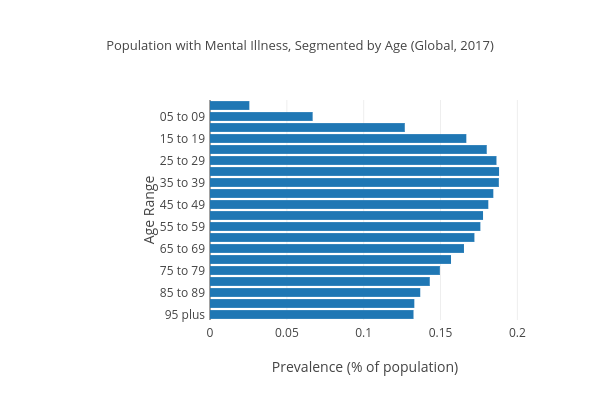
Rebeccacheng9797's interactive graph and data of "Population with Mental Illness, Segmented by Age (Global, 2017)" is a bar chart, showing Votes; with Prevalence (% of population) in the x-axis and Age Range in the y-axis.. The x-axis shows values from 0 to 0.2017040000000016. The y-axis shows values from -0.5 to 19.5.