Edit chart
Loading graph
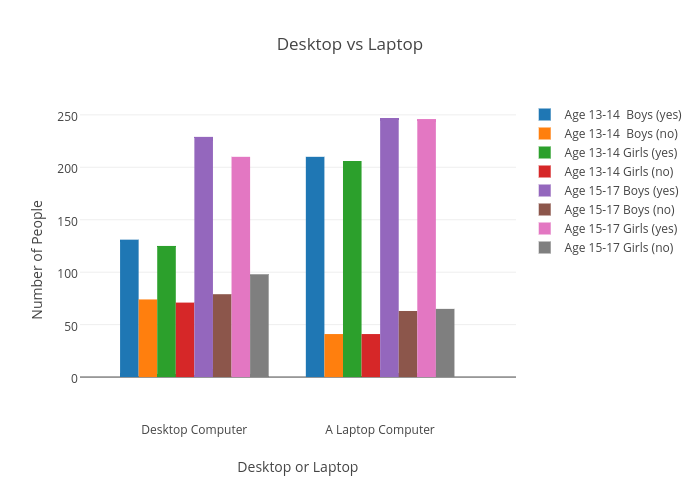
Redsox19's interactive graph and data of "Desktop vs Laptop" is a bar chart, showing Age 13-14 Boys (yes), Age 13-14 Boys (no), Age 13-14 Girls (yes), Age 13-14 Girls (no), Age 15-17 Boys (yes), Age 15-17 Boys (no), Age 15-17 Girls (yes), Age 15-17 Girls (no); with Desktop or Laptop in the x-axis and Number of People in the y-axis.. The x-axis shows values from -0.6156739139945386 to 1.7313478279890777. The y-axis shows values from -40.94856555406659 to 264.1642609038033.