Edit chart
Loading graph
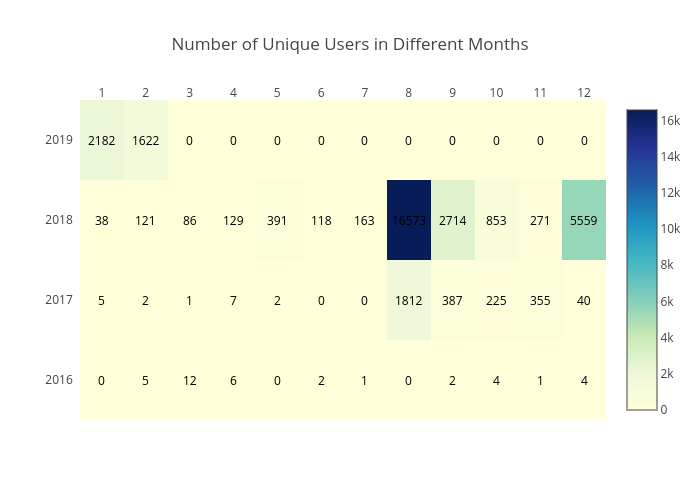
Reichy's interactive graph and data of "Number of Unique Users in Different Months" is a heatmap. The x-axis shows values from 0 to 0. The y-axis shows values from 0 to 0. This visualization has the following annotations: 2182; 1622; 0; 0; 0; 0; 0; 0; 0; 0; 0; 0; 38; 121; 86; 129; 391; 118; 163; 16573; 2714; 853; 271; 5559; 5; 2; 1; 7; 2; 0; 0; 1812; 387; 225; 355; 40; 0; 5; 12; 6; 0; 2; 1; 0; 2; 4; 1; 4