Edit chart
Loading graph
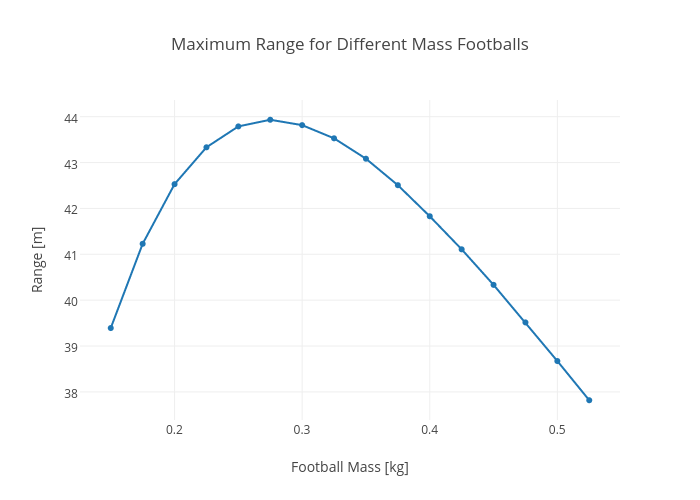
Rhettallain's interactive graph and data of "Maximum Range for Different Mass Footballs" is a scatter chart, showing y; with Football Mass [kg] in the x-axis and Range [m] in the y-axis.. The x-axis shows values from 0.12660477127397932 to 0.5483952287260208. The y-axis shows values from 37.35765722233959 to 44.39351603462272.