Edit chart
Loading graph
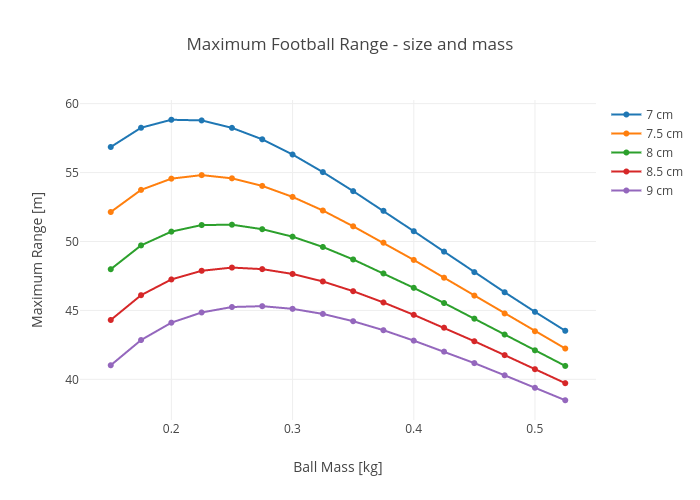
Rhettallain's interactive graph and data of "Maximum Football Range - size and mass " is a scatter chart, showing 7 cm, 7.5 cm, 8 cm, 8.5 cm, 9 cm; with Ball Mass [kg] in the x-axis and Maximum Range [m] in the y-axis.. The x-axis shows values from 0.12501047778709135 to 0.5499895222129088. The y-axis shows values from 36.95103316320282 to 60.36413348353943.