Edit chart
Loading graph
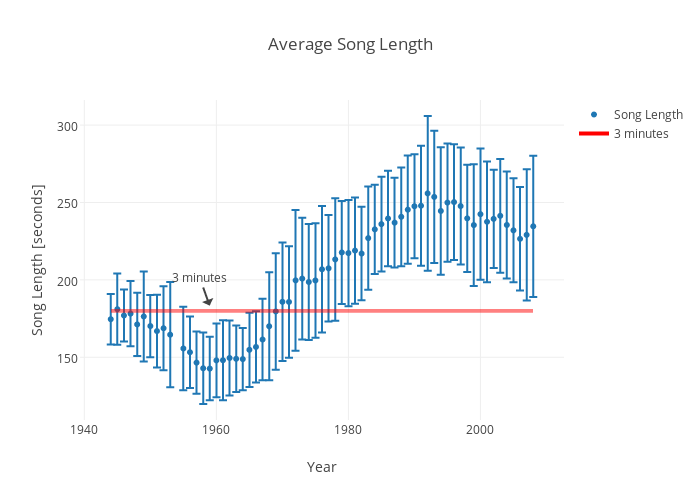
Rhettallain's interactive graph and data of "Average Song Length" is a scatter chart, showing Song Length vs 3 minutes; with Year in the x-axis and Song Length [seconds] in the y-axis.. The x-axis shows values from 1940.225641025641 to 2011.774358974359. The y-axis shows values from 109.45896111111111 to 316.19973888888893. This visualization has the following annotation: 3 minutes