Edit chart
Loading graph
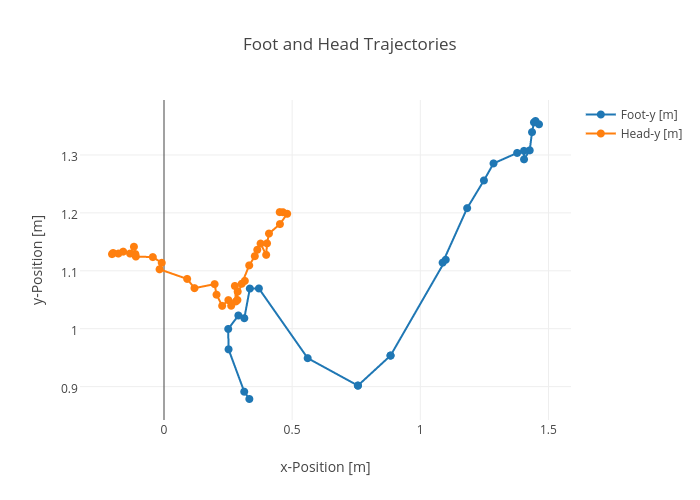
Rhettallain's interactive graph and data of "Foot and Head Trajectories" is a line chart, showing Foot-y [m] vs Head-y [m]; with x-Position [m] in the x-axis and y-Position [m] in the y-axis.. The x-axis shows values from -0.31187082831589963 to 1.5719801770948947. The y-axis shows values from 0.8437075515970338 to 1.393486567889398.