Edit chart
Loading graph
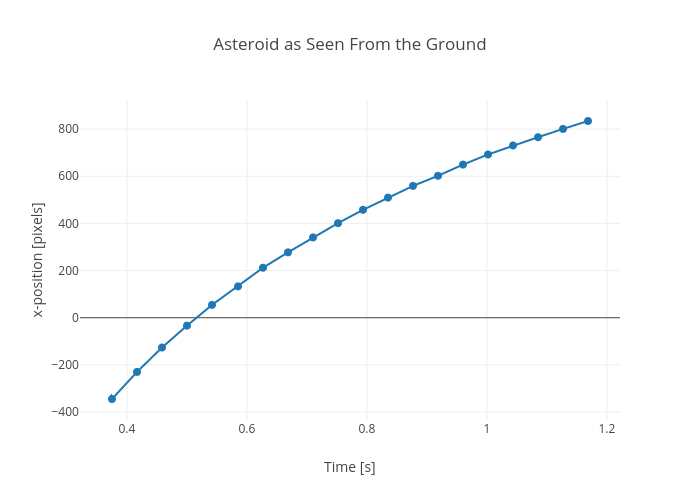
Rhettallain's interactive graph and data of "Asteroid as Seen From the Ground" is a line chart, showing x-position [m]; with Time [s] in the x-axis and x-position [pixels] in the y-axis.. The x-axis shows values from 0.3245151515151515 to 1.2188181818181825. The y-axis shows values from -437.601429183498 to 927.2917131550889.