Edit chart
Loading graph
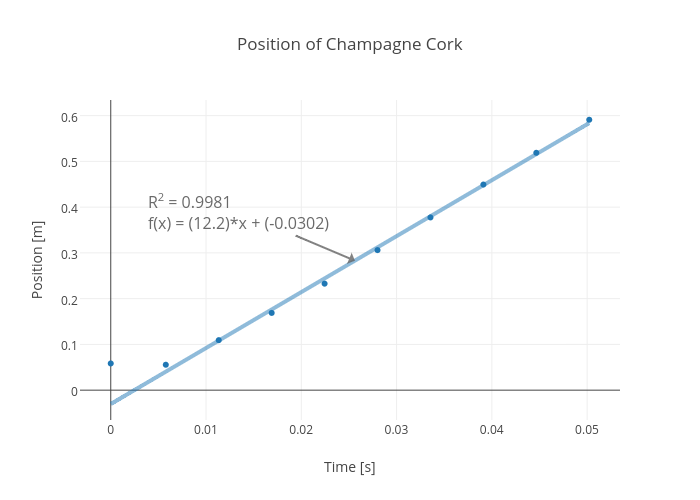
Rhettallain's interactive graph and data of "Position of Champagne Cork" is a scatter chart, showing Position [m] vs Position [m] - fit; with Time [s] in the x-axis and Position [m] in the y-axis.. The x-axis shows values from -0.0031404654277582458 to 0.053362687649980464. The y-axis shows values from -0.06536142749424269 to 0.6369209169643063. This visualization has the following annotation: R2 = 0.9981f(x) = (12.2)*x + (-0.0302)