Edit chart
Loading graph
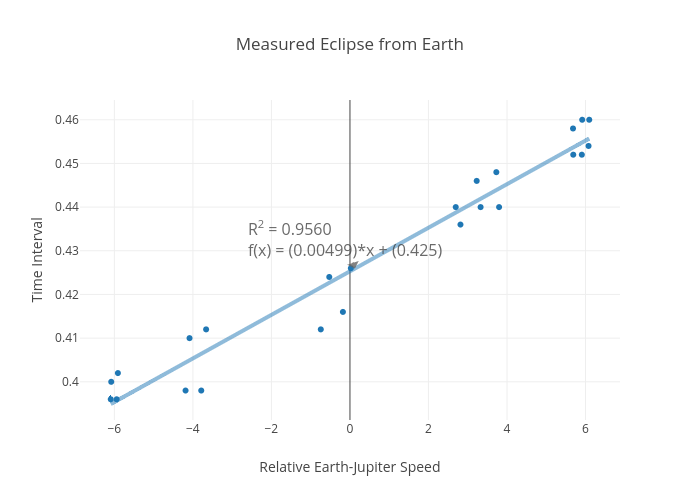
Rhettallain's interactive graph and data of "Measured Eclipse from Earth" is a scatter chart, showing y vs y - fit; with Relative Earth-Jupiter Speed in the x-axis and Time Interval in the y-axis.. The x-axis shows values from -6.846182645145506 to 6.8481058328847295. The y-axis shows values from 0.3912479044390709 to 0.4646571453940731. This visualization has the following annotation: R2 = 0.9560f(x) = (0.00499)*x + (0.425)