Edit chart
Loading graph
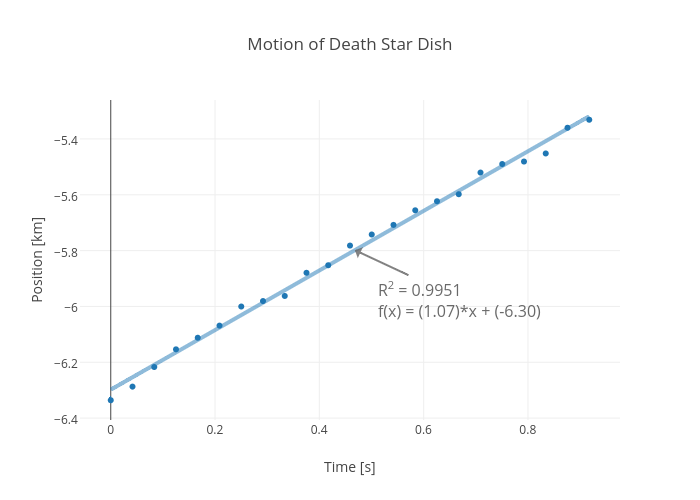
Rhettallain's interactive graph and data of "Motion of Death Star Dish" is a scatter chart, showing Col4 vs Col4 - fit; with Time [s] in the x-axis and Position [km] in the y-axis.. The x-axis shows values from -0.05695478250295317 to 0.9745436713918407. The y-axis shows values from -6.411740470316563 to -5.255587360989413. This visualization has the following annotation: R2 = 0.9951f(x) = (1.07)*x + (-6.30)