Edit chart
Loading graph
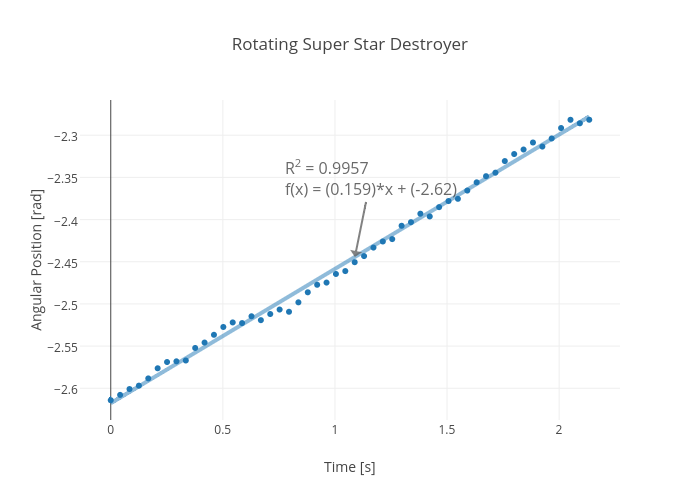
Rhettallain's interactive graph and data of "Rotating Super Star Destroyer" is a scatter chart, showing Col2 vs Col2 - fit; with Time [s] in the x-axis and Angular Position [rad] in the y-axis.. The x-axis shows values from -0.1301710543607306 to 2.2644194643607305. The y-axis shows values from -2.638055922630757 to -2.257762677369243. This visualization has the following annotation: R2 = 0.9957f(x) = (0.159)*x + (-2.62)