Edit chart
Loading graph
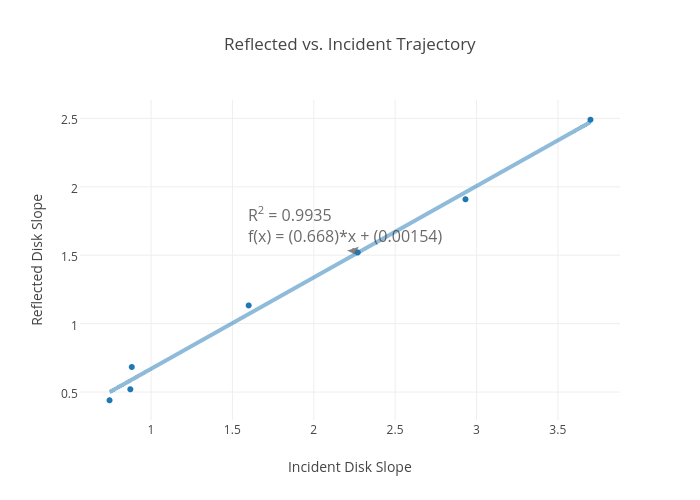
Rhettallain's interactive graph and data of "Reflected vs. Incident Trajectory" is a scatter chart, showing reflected vs reflected - fit; with Incident Disk Slope in the x-axis and Reflected Disk Slope in the y-axis.. The x-axis shows values from 0.5634648751586964 to 3.8815351248413035. The y-axis shows values from 0.2927712724434036 to 2.6372287275565967. This visualization has the following annotation: R2 = 0.9935f(x) = (0.668)*x + (0.00154)