Edit chart
Loading graph
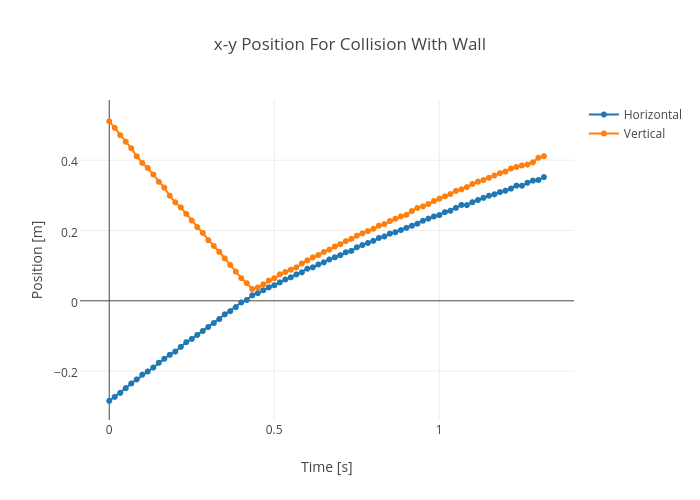
Rhettallain's interactive graph and data of "x-y Position For Collision With Wall" is a line chart, showing Horizontal vs Vertical; with Time [s] in the x-axis and Position [m] in the y-axis.. The x-axis shows values from -0.08855148498276644 to 1.407696520611549. The y-axis shows values from -0.33909184887301347 to 0.571310971407945.