Edit chart
Loading graph
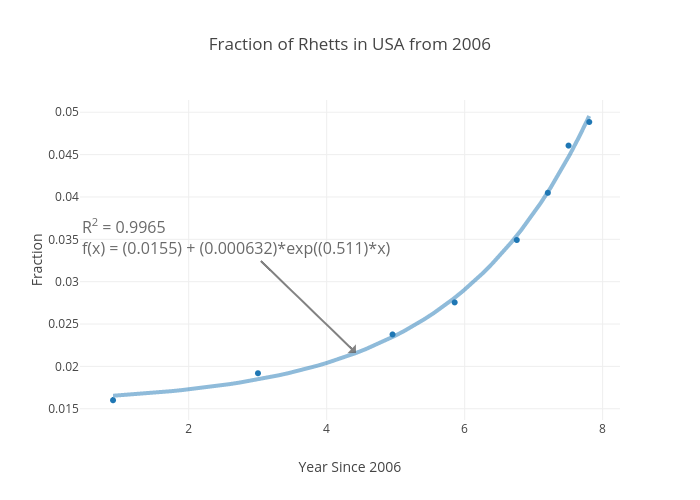
Rhettallain's interactive graph and data of "Fraction of Rhetts in USA from 2006" is a scatter chart, showing Col2 vs Col2 - fit; with Year Since 2006 in the x-axis and Fraction in the y-axis.. The x-axis shows values from 0.48288160539095437 to 8.226531764609046. The y-axis shows values from 0.013625621212101535 to 0.05144820756287602. This visualization has the following annotation: R2 = 0.9965f(x) = (0.0155) + (0.000632)*exp((0.511)*x)