Edit chart
Loading graph
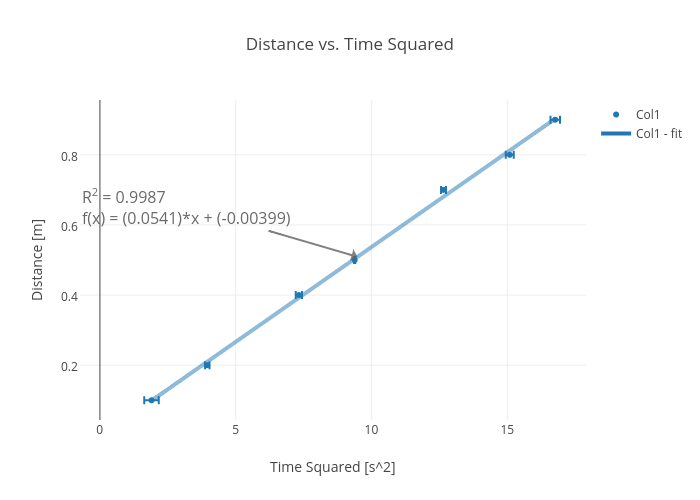
Rhettallain's interactive graph and data of "Distance vs. Time Squared" is a scatter chart, showing Col1 vs Col1 - fit; with Time Squared [s^2] in the x-axis and Distance [m] in the y-axis.. The x-axis shows values from 0.7821583689888887 to 17.784504449211113. The y-axis shows values from 0.0425904317386231 to 0.9574095682613769. This visualization has the following annotation: R2 = 0.9987f(x) = (0.0541)*x + (-0.00399)