Edit chart
Loading graph
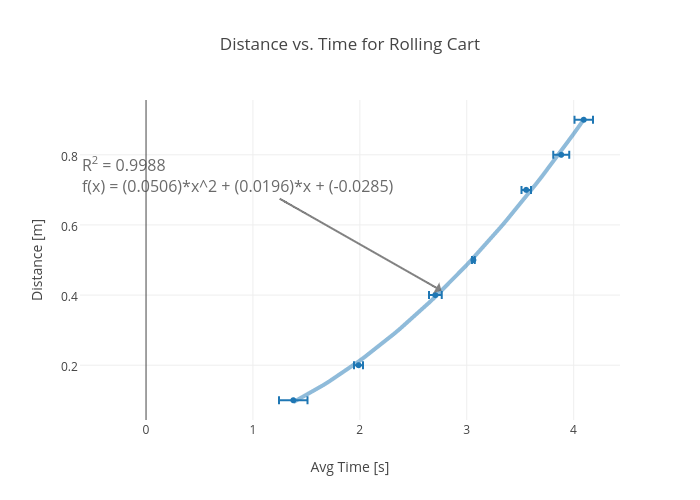
Rhettallain's interactive graph and data of "Distance vs. Time for Rolling Cart" is a scatter chart, showing Col1 vs Col1 - fit; with Avg Time [s] in the x-axis and Distance [m] in the y-axis.. The x-axis shows values from 1.0815833333333331 to 4.343916666666667. The y-axis shows values from 0.0425904317386231 to 0.9574095682613769. This visualization has the following annotation: R2 = 0.9988f(x) = (0.0506)*x^2 + (0.0196)*x + (-0.0285)