Edit chart
Loading graph
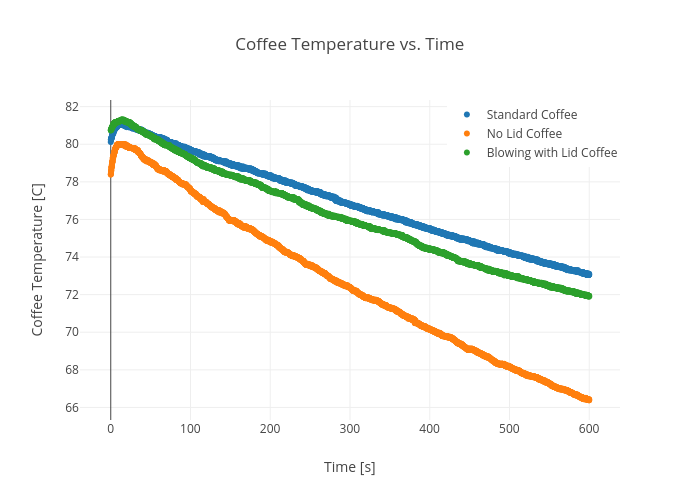
Rhettallain's interactive graph and data of "Coffee Temperature vs. Time" is a scatter chart, showing Standard Coffee, No Lid Coffee, Blowing with Lid Coffee; with Time [s] in the x-axis and Coffee Temperature [C] in the y-axis.. The x-axis shows values from -40.23991275899673 to 640.2399127589968. The y-axis shows values from 65.2903435249293 to 82.3958030684707.