Edit chart
Loading graph
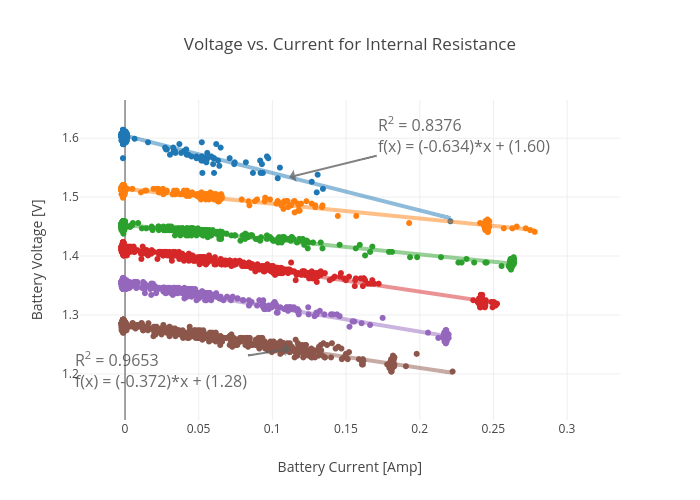
Rhettallain's interactive graph and data of "Voltage vs. Current for Internal Resistance" is a scatter chart, showing Potential, Potential #2, Potential #3, Potential #4, Potential #5, Potential #6, Potential - fit, Potential #6 - fit, Potential #2 - fit, Potential #3 - fit, Potential #4 - fit, Potential #5 - fit; with Battery Current [Amp] in the x-axis and Battery Voltage [V] in the y-axis.. The x-axis shows values from -0.030546118028317512 to 0.33586503403269974. The y-axis shows values from 1.1217338003886594 to 1.6647685231939893. This visualization has the following annotations: R2 = 0.8376f(x) = (-0.634)*x + (1.60); R2 = 0.9653f(x) = (-0.372)*x + (1.28)