Edit chart
Loading graph
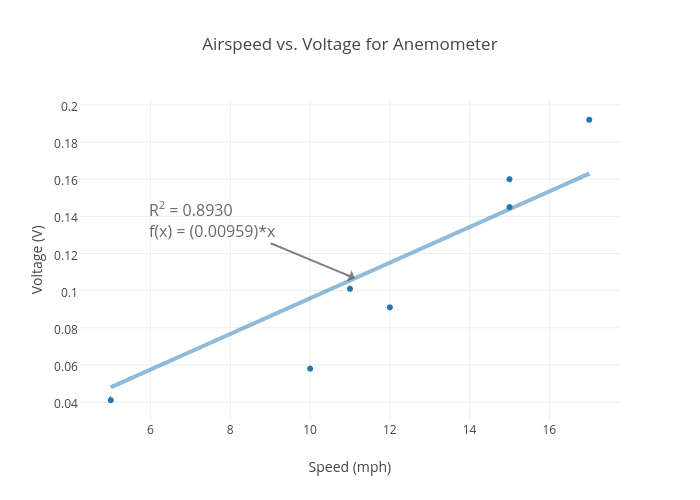
Rhettallain's interactive graph and data of "Airspeed vs. Voltage for Anemometer" is a scatter chart, showing Col2 vs Col2 - fit; with Speed (mph) in the x-axis and Voltage (V) in the y-axis.. The x-axis shows values from 4.261802575107296 to 17.738197424892704. The y-axis shows values from 0.030431046431046434 to 0.20256895356895357. This visualization has the following annotation: R2 = 0.8930f(x) = (0.00959)*x