Edit chart
Loading graph
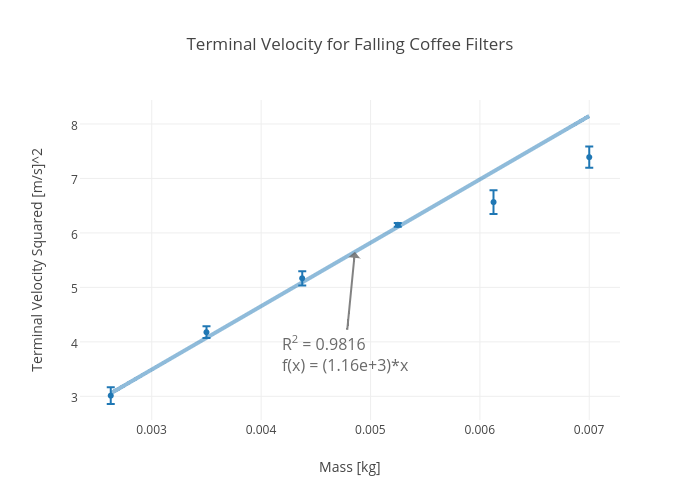
Rhettallain's interactive graph and data of "Terminal Velocity for Falling Coffee Filters" is a scatter chart, showing vt^2 [m/s]^2 vs vt^2 [m/s]^2 - fit; with Mass [kg] in the x-axis and Terminal Velocity Squared [m/s]^2 in the y-axis.. The x-axis shows values from 0.002356835399449036 to 0.0072681646005509646. The y-axis shows values from 2.5650709947080887 to 8.440387934546314. This visualization has the following annotation: R2 = 0.9816f(x) = (1.16e+3)*x