Edit chart
Loading graph
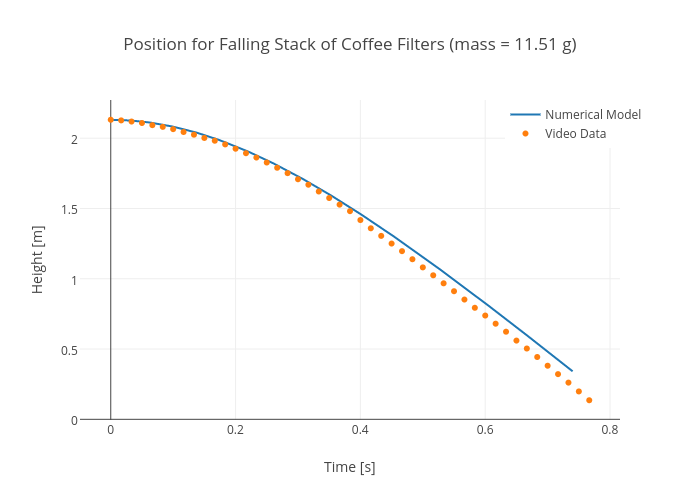
Rhettallain's interactive graph and data of "Position for Falling Stack of Coffee Filters (mass = 11.51 g)" is a scatter chart, showing Numerical Model vs Video Data; with Time [s] in the x-axis and Height [m] in the y-axis.. The x-axis shows values from -0.04773911175554466 to 0.814405778422209. The y-axis shows values from -0.004087690035785768 to 2.271000009513508.