Edit chart
Loading graph
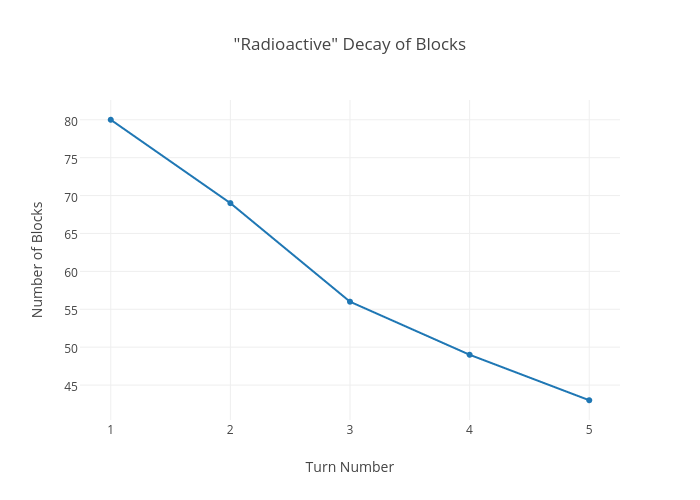
Rhettallain's interactive graph and data of ""Radioactive" Decay of Blocks" is a line chart, showing B; with Turn Number in the x-axis and Number of Blocks in the y-axis.. The x-axis shows values from 0.7448071216617211 to 5.255192878338279. The y-axis shows values from 40.17167919799499 to 82.82832080200501.