Edit chart
Loading graph
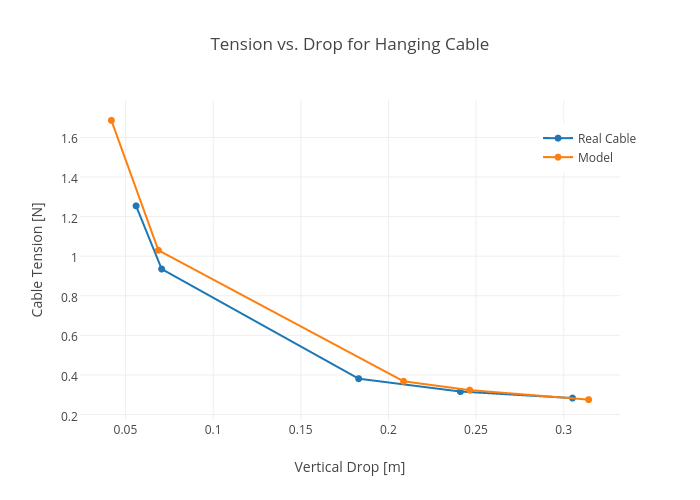
Rhettallain's interactive graph and data of "Tension vs. Drop for Hanging Cable" is a line chart, showing Real Cable vs Model; with Vertical Drop [m] in the x-axis and Cable Tension [N] in the y-axis.. The x-axis shows values from 0.02391119719131468 to 0.33217920280868535. The y-axis shows values from 0.16222396721311477 to 1.7991000327868854.