Edit chart
Loading graph
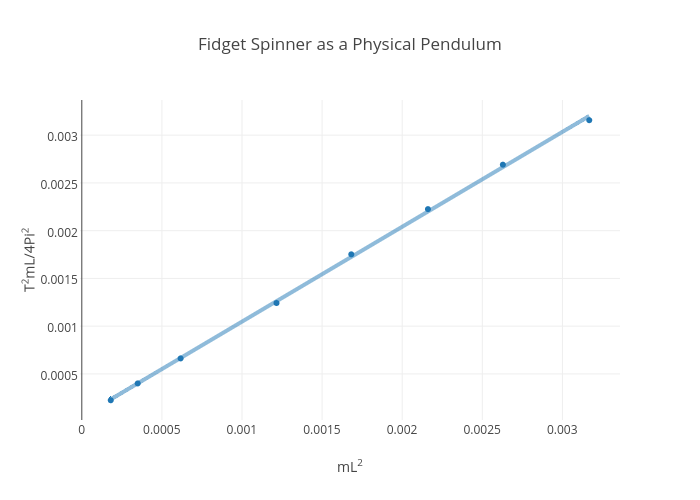
Rhettallain's interactive graph and data of "Fidget Spinner as a Physical Pendulum" is a scatter chart, showing A; with mL2 in the x-axis and T2mL/4Pi2 in the y-axis.. The x-axis shows values from -8.456208071748906e-06 to 0.003356777008071749. The y-axis shows values from 5.045306320491423e-06 to 0.0033759653354795086. This visualization has the following annotation: $$R^2 = 0.9995\\0.9931\cdot x+0.000054$$