Edit chart
Loading graph
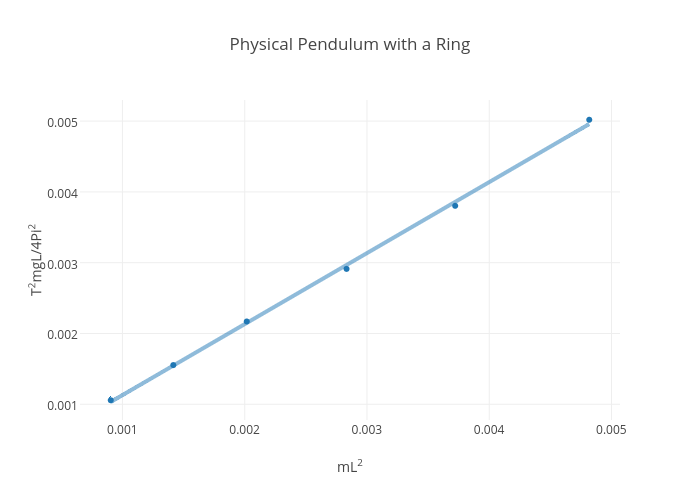
Rhettallain's interactive graph and data of "Physical Pendulum with a Ring" is a scatter chart, showing A; with mL2 in the x-axis and T2mgL/4Pi2 in the y-axis.. The x-axis shows values from 0.0006545348222671569 to 0.005067719980232843. The y-axis shows values from 0.0007602612326126566 to 0.005315395710387343. This visualization has the following annotation: $$R^2 = 0.9990\\1.003\cdot x+0.000127$$