Edit chart
Loading graph
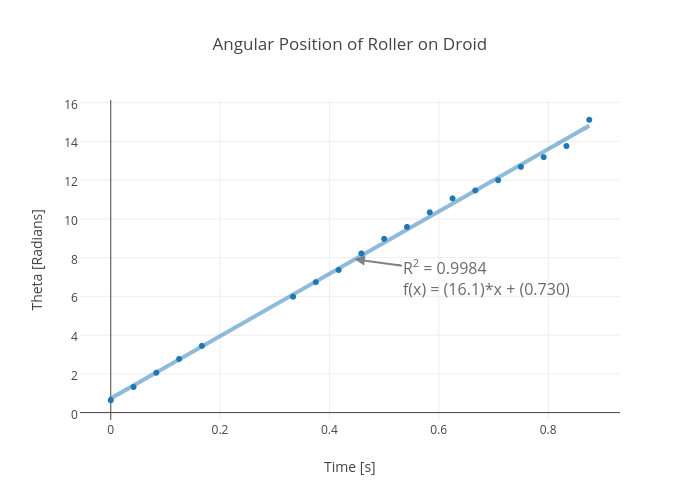
Rhettallain's interactive graph and data of "Angular Position of Roller on Droid" is a scatter chart, showing Col2 vs Col2 - fit; with Time [s] in the x-axis and Theta [Radians] in the y-axis.. The x-axis shows values from -0.05718147625763988 to 0.9321814762576399. The y-axis shows values from -0.46932283489210547 to 16.222387272792105. This visualization has the following annotation: R2 = 0.9984f(x) = (16.1)*x + (0.730)