Edit chart
Loading graph
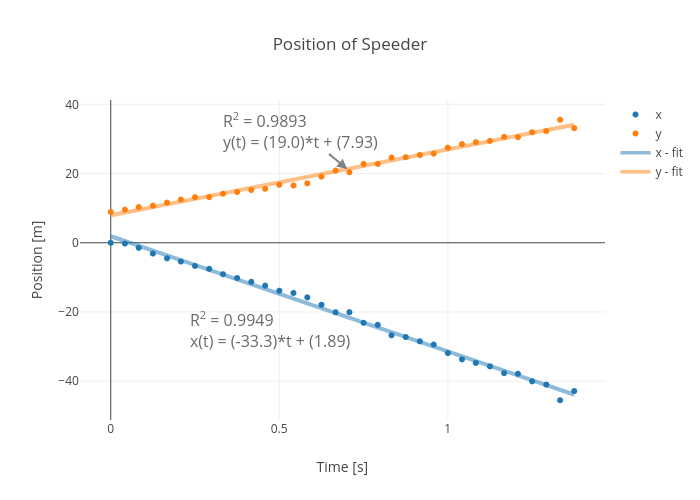
Rhettallain's interactive graph and data of "Position of Speeder" is a scatter chart, showing x, y, x - fit, y - fit; with Time [s] in the x-axis and Position [m] in the y-axis.. The x-axis shows values from -0.0899715504978663 to 1.4649715504978662. The y-axis shows values from -53.1589109407418 to 57.08762759040384. This visualization has the following annotations: R2 = 0.9949x(t) = (-33.3)*t + (1.89); R2 = 0.9893y(t) = (19.0)*t + (7.93)