Edit chart
Loading graph
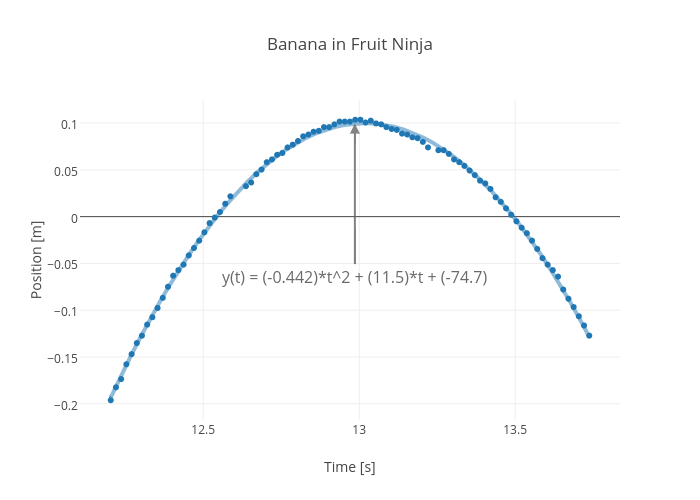
Rhettallain's interactive graph and data of "Banana in Fruit Ninja" is a scatter chart, showing Col3 vs Col3 - fit; with Time [s] in the x-axis and Position [m] in the y-axis.. The x-axis shows values from 12.103631838097792 to 13.836944609738344. The y-axis shows values from -0.21916145051945501 to 0.12646277828345673. This visualization has the following annotation: y(t) = (-0.442)*t^2 + (11.5)*t + (-74.7)