Edit chart
Loading graph
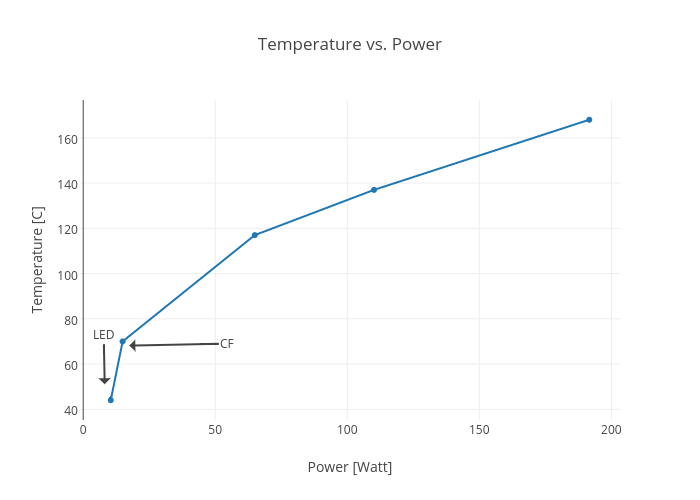
Rhettallain's interactive graph and data of "Temperature vs. Power" is a line chart, showing Temperature [C]; with Power [Watt] in the x-axis and Temperature [C] in the y-axis.. The x-axis shows values from -1.4020294943820222 to 203.43202949438202. The y-axis shows values from 34.01915020945542 to 177.9808497905446. This visualization has the following annotations: LED; CF