Edit chart
Loading graph
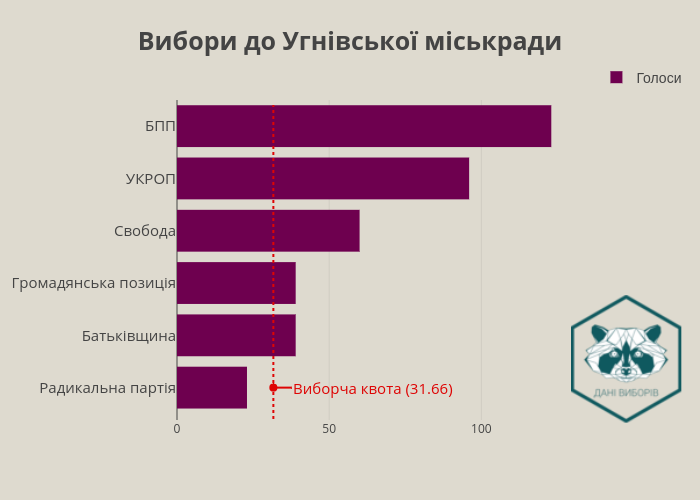
Robik's interactive graph and data of "Вибори до Угнівської міськради" is a bar chart, showing Голоси; with in the x-axis. The x-axis shows values from 0 to 129.47368421052633. The y-axis shows values from -0.6251028806584362 to 5.5. This visualization has the following annotation: Виборча квота (31.66)