Edit chart
Loading graph
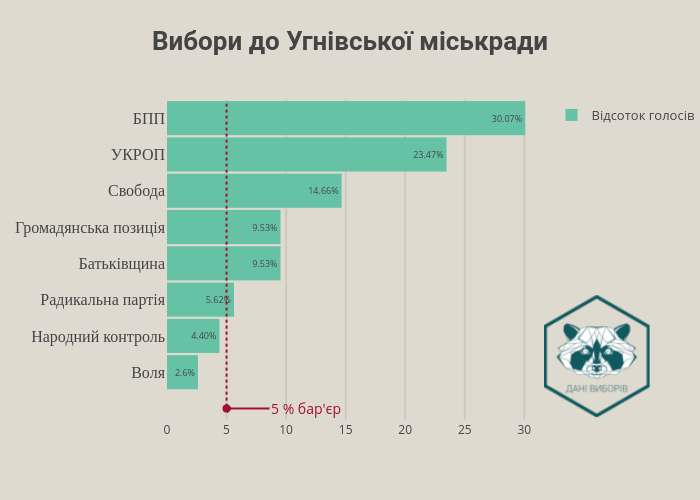
Robik's interactive graph and data of "Вибори до Угнівської міськради" is a bar chart, showing Відсоток голосів; with in the x-axis and in the y-axis.. The x-axis shows values from 0 to 31.652631578947368. The y-axis shows values from -1.5476190476190477 to 7.5. This visualization has the following annotation: 5 % бар'єр