Edit chart
Loading graph
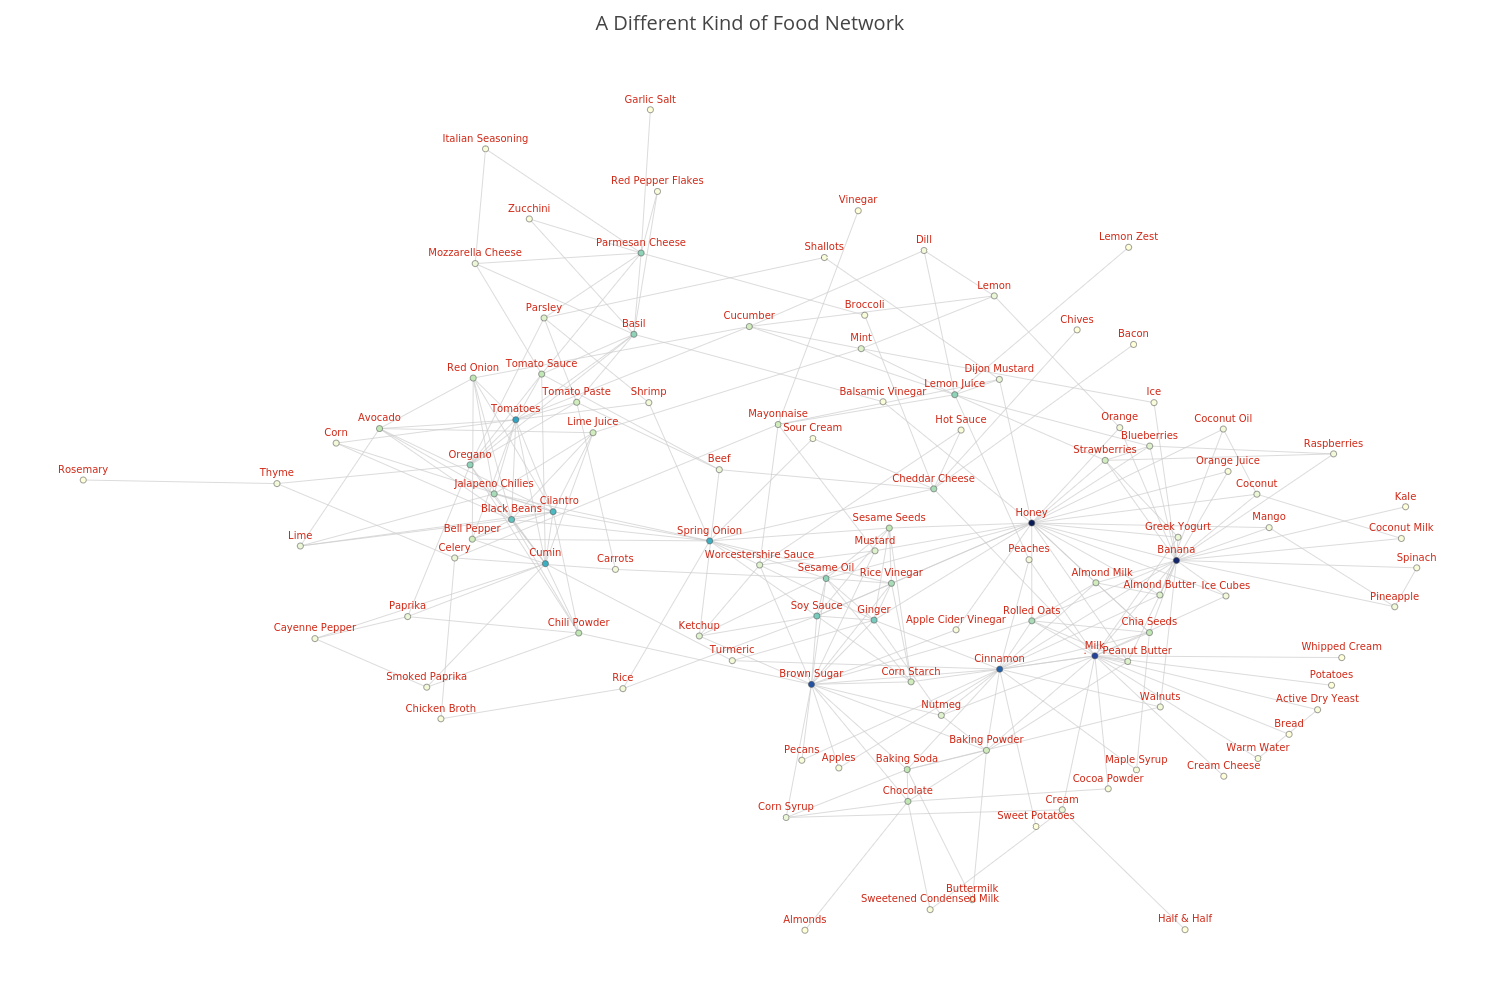
Robmattles's interactive graph and data of "A Different Kind of Food Network" is a line chart, showing Trace 1, y. The x-axis shows values from -361.5988863892013 to 261.41888638920136. The y-axis shows values from -289.5358409506399 to 314.9058409506399.