Edit chart
Loading graph
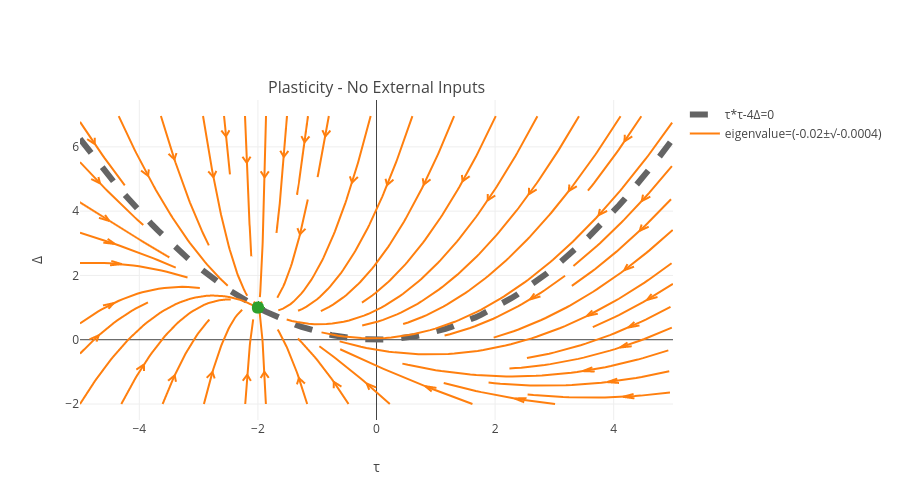
Rzalpaca's interactive graph and data of "Δ vs τ" is a line chart, showing τ*τ-4Δ=0 vs eigenvalue=(-0.02±√-0.0004); with τ in the x-axis and Δ in the y-axis.. The x-axis shows values from 0 to 0. The y-axis shows values from 0 to 0. This visualization has the following annotation: Plasticity - No External Inputs