Edit chart
Loading graph
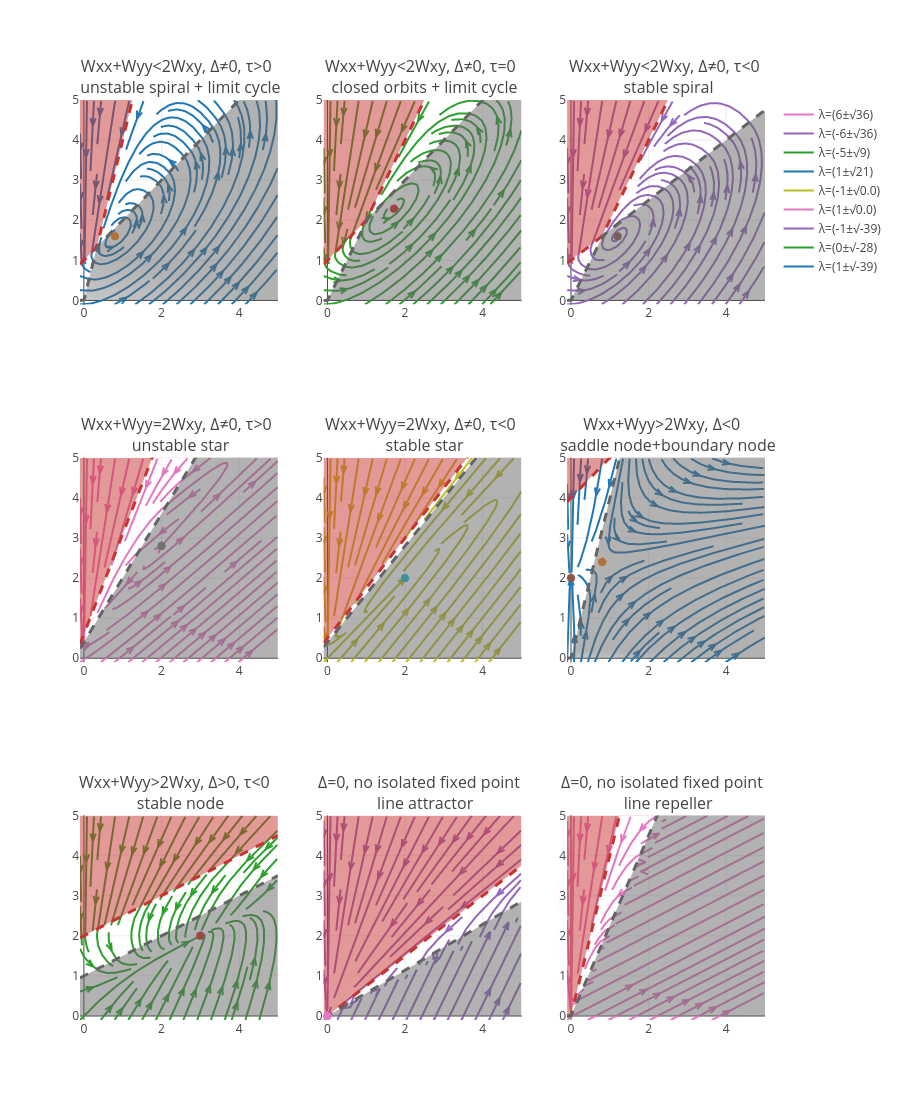
Rzalpaca's interactive graph and data of "λ=(1±√-39), λ=(0±√-28), λ=(-1±√-39), λ=(1±√0.0), λ=(-1±√0.0), λ=(1±√21), λ=(-5±√9), λ=(-6±√36), λ=(6±√36)" is a line chart, showing λ=(1±√-39), λ=(0±√-28), λ=(-1±√-39), λ=(1±√0.0), λ=(-1±√0.0), λ=(1±√21), λ=(-5±√9), λ=(-6±√36), λ=(6±√36). The x-axis shows values from -0.1 to 5. The y-axis shows values from -0.1 to 5. This visualization has the following annotations: Wxx+Wyy<2Wxy, Δ≠0, τ>0 unstable spiral + limit cycle; Wxx+Wyy<2Wxy, Δ≠0, τ=0 closed orbits + limit cycle; Wxx+Wyy<2Wxy, Δ≠0, τ<0 stable spiral; Wxx+Wyy=2Wxy, Δ≠0, τ>0 unstable star; Wxx+Wyy=2Wxy, Δ≠0, τ<0 stable star; Wxx+Wyy>2Wxy, Δ<0 saddle node+boundary node; Wxx+Wyy>2Wxy, Δ>0, τ<0 stable node; Δ=0, no isolated fixed point line attractor; Δ=0, no isolated fixed point line repeller