Edit chart
Loading graph
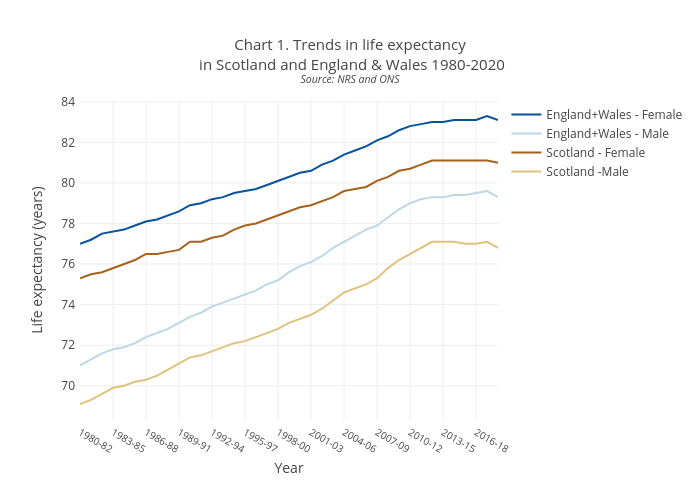
Scotpho's interactive graph and data of "Chart 1. Trends in life expectancy in Scotland and England & Wales 1980-2020Source: NRS and ONS" is a line chart, showing England+Wales - Female, England+Wales - Male, Scotland - Female, Scotland -Male; with Year in the x-axis and Life expectancy (years) in the y-axis.. The x-axis shows values from 0 to 0. The y-axis shows values from 0 to 0.