Edit chart
Loading graph
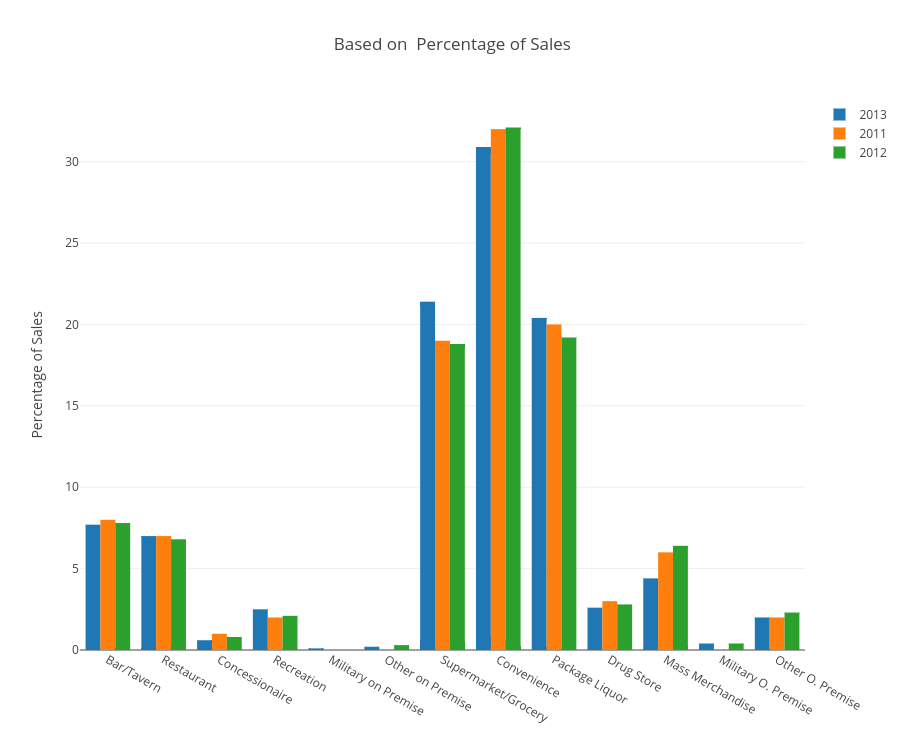
Scottjanish's interactive graph and data of "Based on Percentage of Sales" is a bar chart, showing 2013, 2011, 2012; with Percentage of Sales in the y-axis. The x-axis shows values from -0.5 to 12.5. The y-axis shows values from 0 to 33.78947368421053.