Edit chart
Loading graph
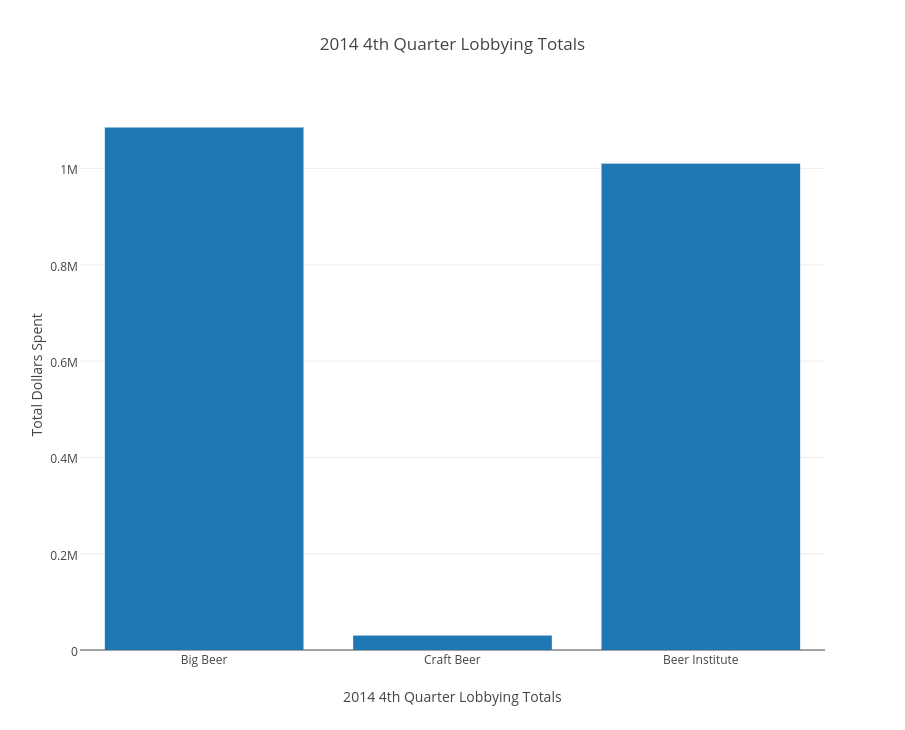
Scottjanish's interactive graph and data of "2014 4th Quarter Lobbying Totals" is a bar chart, showing TOTAL Lobbying Dollars Spent; with 2014 4th Quarter Lobbying Totals in the x-axis and Total Dollars Spent in the y-axis.. The x-axis shows values from -0.5 to 2.5. The y-axis shows values from 0 to 1142105.2631578948.