Edit chart
Loading graph
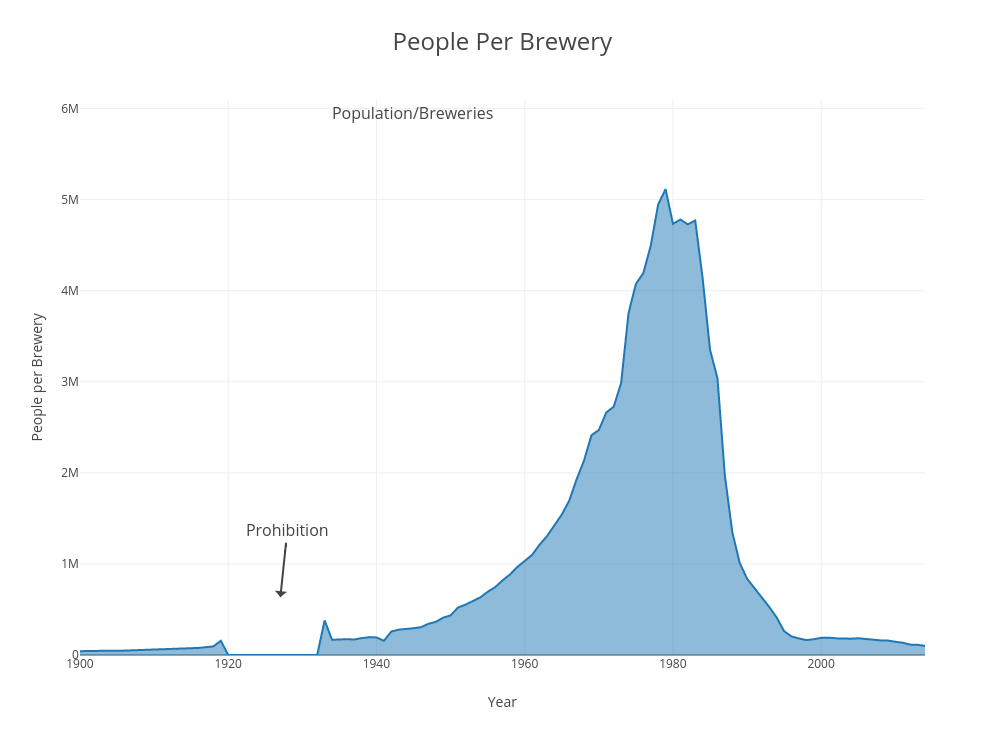
Scottjanish's interactive graph and data of "People Per Brewery" is a filled line chart, showing People per Brewery; with Year in the x-axis and People per Brewery in the y-axis.. The x-axis shows values from 1900 to 2014. The y-axis shows values from 0 to 5950770.906450398. This visualization has the following annotations: Population/Breweries; Prohibition