Edit chart
Loading graph
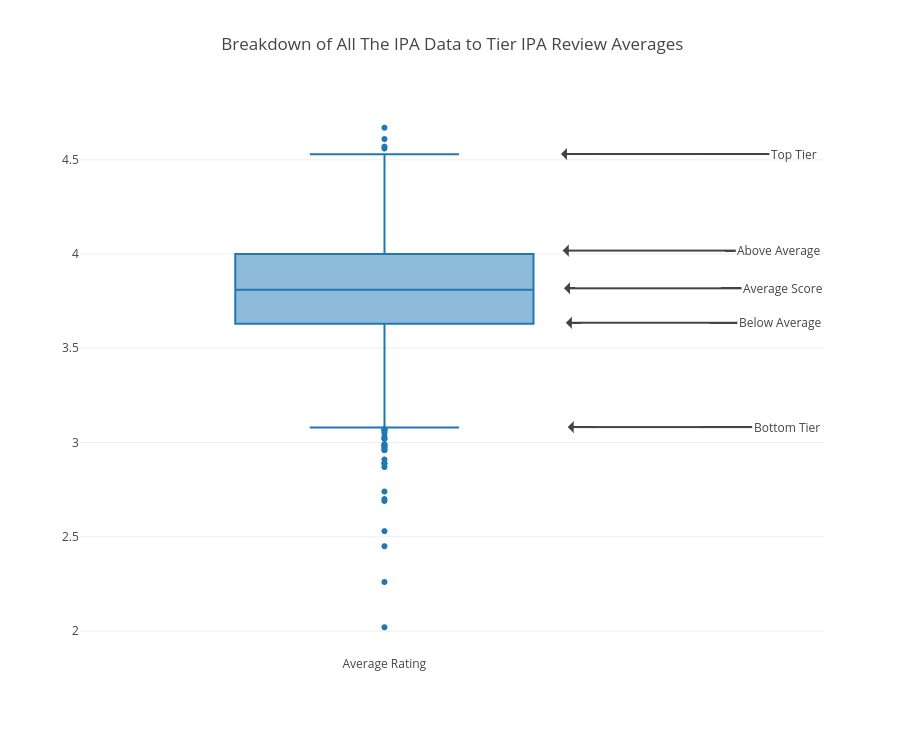
Scottjanish's interactive graph and data of "Breakdown of All The IPA Data to Tier IPA Review Averages" is a box plot, showing Average Rating. The x-axis shows values from -0.5 to 0.7235594190858908. The y-axis shows values from 1.8727777777777779 to 4.817222222222222. This visualization has the following annotations: Top Tier; Below Average; Above Average; Average Score; Bottom Tier