Edit chart
Loading graph
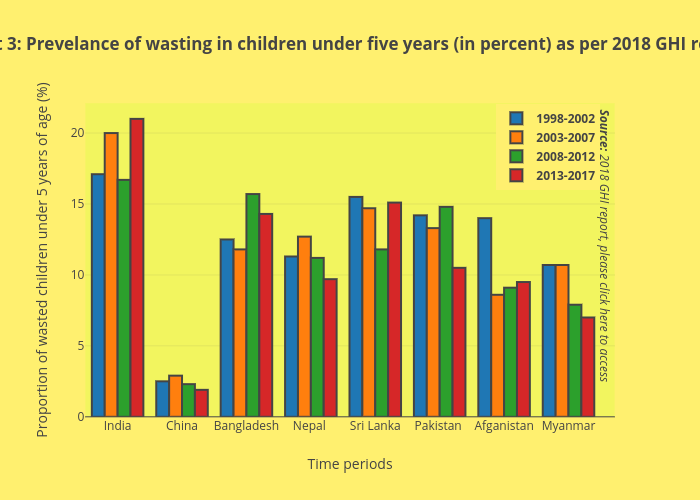
Shambhughatakb01c's interactive graph and data of "Chart 3: Prevelance of wasting in children under five years (in percent) as per 2018 GHI report" is a grouped bar chart, showing 1998-2002, 2003-2007, 2008-2012, 2013-2017; with Time periods in the x-axis and Proportion of wasted children under 5 years of age (%) in the y-axis.. The x-axis shows values from -0.5 to 7.656110099603727. The y-axis shows values from 0 to 22.105263157894736. This visualization has the following annotation: Source: 2018 GHI report, please click here to access