Edit chart
Loading graph
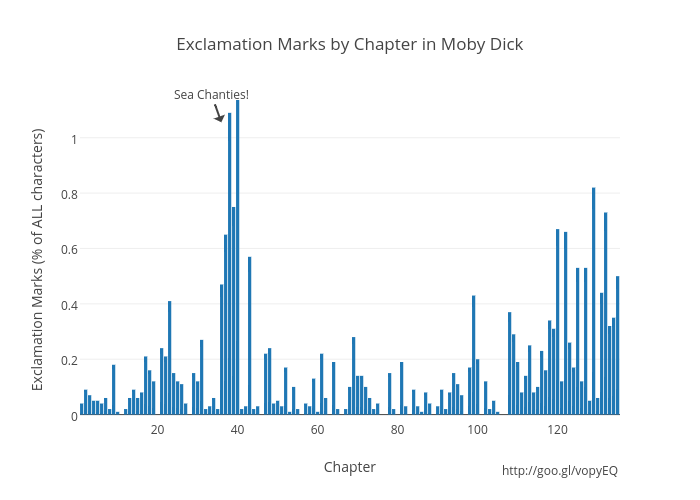
Sineof1's interactive graph and data of "Exclamation Marks by Chapter in Moby Dick" is a bar chart, showing trace 0; with Chapter in the x-axis and Exclamation Marks (% of ALL characters) in the y-axis.. The x-axis shows values from 0.5870893143748831 to 135.58708931437488. The y-axis shows values from -0.019524922565546304 to 1.1363793975720118. This visualization has the following annotations: Sea Chanties!; http://goo.gl/vopyEQ