Edit chart
Loading graph
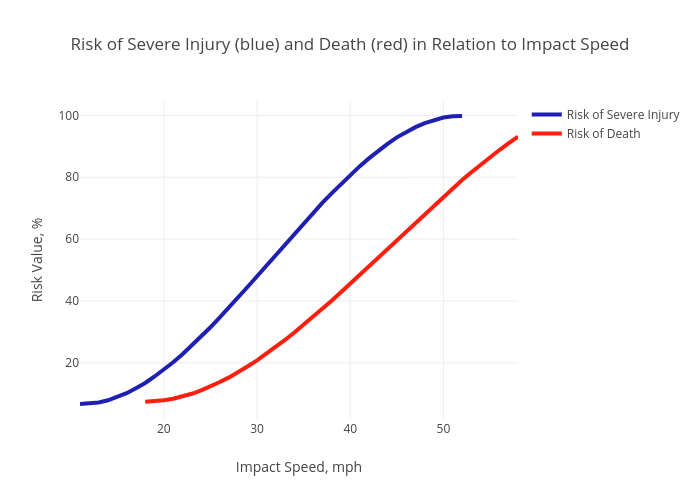
Sleavik's interactive graph and data of "Risk of Severe Injury (blue) and Death (red) in Relation to Impact Speed" is a line chart, showing Risk of Severe Injury vs Risk of Death ; with Impact Speed, mph in the x-axis and Risk Value, % in the y-axis.. The x-axis shows values from 11 to 58. The y-axis shows values from 1.5277777777777768 to 104.97222222222221.