Edit chart
Loading graph
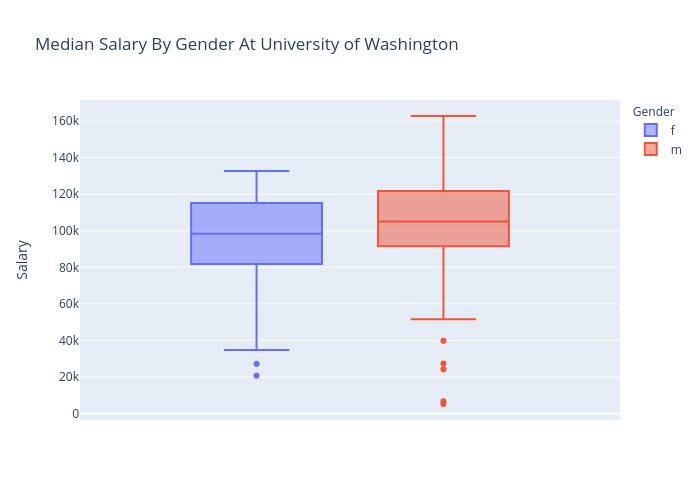
Stellaweng's interactive graph and data of "Median Salary By Gender At University of Washington" is a box plot, showing f vs m; with Salary in the y-axis. The x-axis shows values from 0 to 0. The y-axis shows values from 0 to 0.