Edit chart
Loading graph
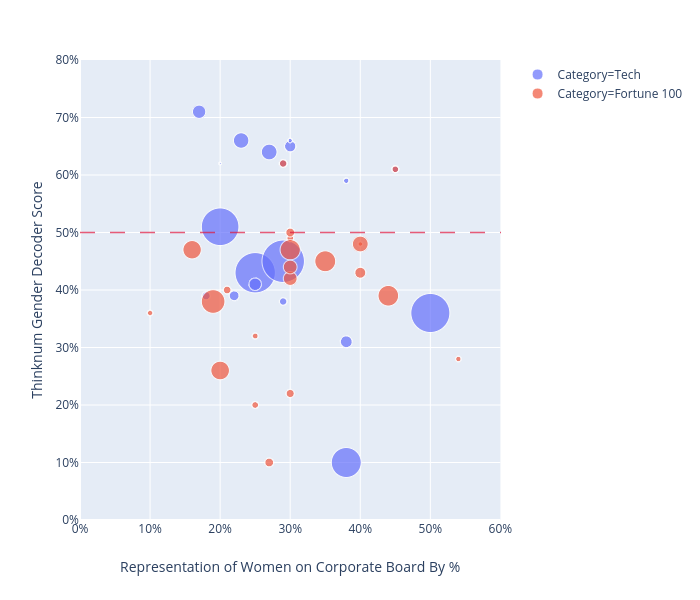
Stellaweng's interactive graph and data of "Thinknum Gender Decoder Score vs Representation of Women on Corporate Board By %" is a scatter chart, showing Category=Tech vs Category=Fortune 100; with Representation of Women on Corporate Board By % in the x-axis and Thinknum Gender Decoder Score in the y-axis.. The x-axis shows values from 0 to 0.6. The y-axis shows values from 0 to 0.8.