Edit chart
Loading graph
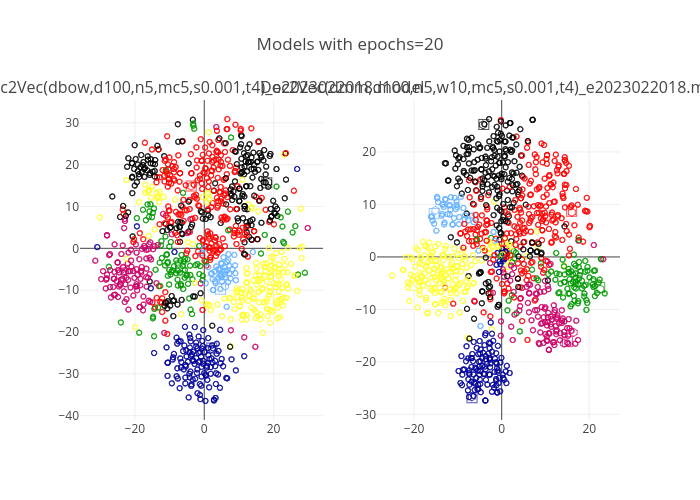
Stipe's interactive graph and data of "Models with epochs=20" is a scatter chart. The x-axis shows values from -35.41451483539079 to 33.827400501284345. The y-axis shows values from -40.82883725017966 to 35.24266323894919. This visualization has the following annotations: Doc2Vec(dbow,d100,n5,mc5,s0.001,t4)_e2023022018.model; Doc2Vec(dmm,d100,n5,w10,mc5,s0.001,t4)_e2023022018.model